What Pushes the Four Arrows?
Read the transcript of “What Pushes the Four Arrows?”
Film transcript: What Pushes the Four Arrows?
The first film followed additions and losses through one population window. What pushes those arrows in the real Bay? Keep that window open as cold, shelter, predators, and harvest change around it. The same colour map stays.
Scientists ask two separate questions about a factor. First, which living and nonliving parts are involved? Biotic factors are living parts, such as grass and big crabs. Abiotic factors are nonliving parts, such as temperature and salt. Second, is the change natural, human-caused, or both? A cold winter is abiotic and natural. A stone wall is abiotic and human-made. Watch a nonliving factor act. During a very cold winter, more buried crabs can die before spring.
Lab tests also show especially low survival in cold, low-salt water. Both conditions can widen the death arrow. They may also act together. Now watch living and nonliving parts work together. Young crabs use grass and shallow water as refuge from bigger crabs. With less refuge, more young crabs may stay exposed. That can increase deaths from predation.
Refuge changes risk, not certainty. Suppose a stone wall replaces a gently sloping shore. The shallow refuge becomes smaller. Which population arrow could change first, and in which direction? Think in arrows, not labels.
The death arrow could widen if more exposed young crabs are eaten. The wall is not the only possible cause of change. It alters habitat, while cold, harvest, and other factors may change other arrows. That wording keeps the claim honest. Harvest is a human-caused loss. Overharvesting means removing a species faster than it can replace itself.
Female crabs carry eggs for the next generation. Leaving more adults can support later births, but the other arrows keep moving. More adults do not guarantee more survivors. Sustainable harvest means taking only as many as the population can replace over time. A harvest limit can reduce one loss and leave more adults to reproduce. A harsh winter, poor refuge, or few new young can still slow recovery. So recovery is not certain. Managers keep measuring every year. A population graph shows what changed, not which factor caused it. To test a cause, compare the graph with measurements of that factor.
Survey estimates, experiments, and models each add evidence. None makes every arrow stand still. Together, they narrow possible explanations. Return to the shared window. Natural events and human actions can change the same additions and losses.
Management can change an arrow, but not command the whole population. The balance still decides the direction of change.
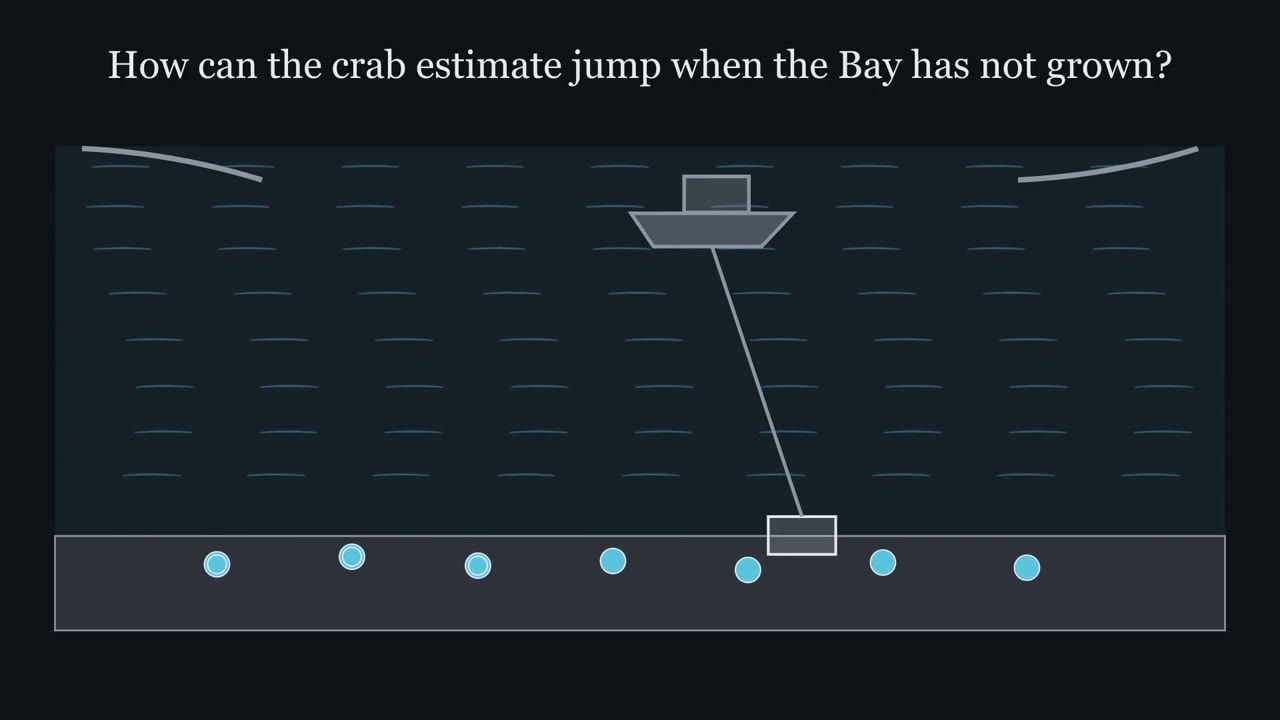
How can the Bay's blue crab estimate more than double when the Bay does not get bigger?
Continue in the lesson: Populations Rise and Fall →
3:40 · Free, with captions and a transcript. The lesson has the full text, the questions and the sources.
More films from this lesson
How this film was made. Narration: an AI narrator voice (Kokoro, af_heart) reading narration written from this lesson's text. Animation: AI-generated in code (Manim) by Claude, a schematic with no drawn molecular structures. Captions come from the narration script. See something wrong? Report it.