Watch the Per-Capita Rate
Read the transcript of “Watch the Per-Capita Rate”
Film transcript: Watch the Per-Capita Rate
Here is a small population, and the rate it is growing at right now. Will tomorrow's rate be the same, or faster? Look at one individual. Over day it may give birth, and it may die. Births minus deaths, per individual, is the per-capita rate. Multiply that per-capita rate by the population size, N. In a closed population, with no one moving in or out, that product is the population's growth. This one rule runs the whole film. On the left, plot the per-capita rate against N. First, hold it flat, the same value at every size.
Now watch the right panel. Each newcomer soon adds newcomers of its own. So each day's gain is bigger than the day before. By day ten, the population is far above what steady adding would give. This compounding is exponential growth, a J-shaped curve. No real population keeps this up. As numbers rise, each individual gets less food, space or shelter.
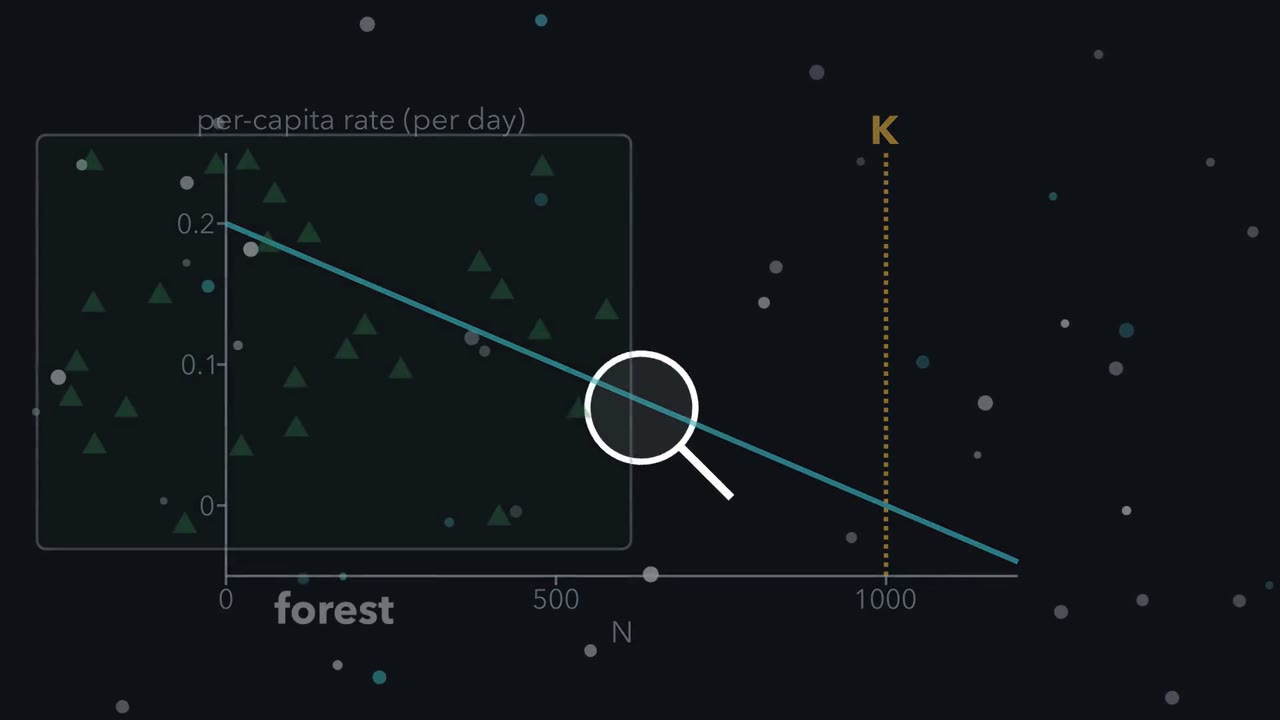
Births fall, or deaths rise. So tilt the line. Let the per-capita rate fall as N rises. The logistic model assumes it falls in a straight line. The line hits zero at a size called K, the carrying capacity. There, births balance deaths on average, so the per-capita rate is zero. Redraw the right panel with the falling line. The curve rises, steepens, then bends and levels off toward K. That is the S-shaped curve. Here is a question before we go on. On this S-curve, at what size is the population adding the most individuals per day?
Halfway to K. When the population is small, each individual adds a lot, but there are few of them. Near K, there are many, each adding little. Multiply the two at every size and plot the product in orange. It makes a hump, highest at half of K. That is where the S-curve is steepest. At K, the hump comes back down to zero.
Growth stops there because each individual's per-capita rate has fallen to zero. So the whole story sits in one teal line. Hold it flat, and growth compounds. Let it fall to zero, and growth stops at K. The straight line is the model's assumption, not a measurement. Whether real populations have a falling line must be tested in the field.
A population of 100 growing continuously at a constant per-capita rate of 0.2 per day reaches 739 in ten days, not 300. What has to change, per individual, for that growth to stop?
Continue in the lesson: Population Growth and Regulation →
3:05 · Free, with captions and a transcript. The lesson has the full text, the questions and the sources.
More films from this lesson
How this film was made. Narration: written from this lesson's text and read by an AI narrator voice (Kokoro, af_heart). Animation: AI-generated in code (Manim) by Claude, a schematic with no drawn molecular structures. Captions come from the narration script. See something wrong? Report it.