Reading the River's Record
Read the transcript of “Reading the River's Record”
Film transcript: Reading the River's Record
The first film followed ripples through one model river. How can scientists tell whether real blue and white catfish populations changed? They need the river's record, not one visit. Murky water hides fish from view. Scientists from the Virginia Institute of Marine Science repeat bottom tows at many places. A boat pulls the same kind of net for a set time. The catch is sorted and counted. Repeating the method makes years more useful to compare. Those counts become a survey index for each fish. An index tracks how common that fish is in the surveyed area. It is not a count of every fish in the river. Think of it as a consistent signal from repeated samples.
Keep blue catfish blue and white catfish gold, matching the first film. Build a separate trace for each fish across time. The two indexes use different math and river areas. Their heights cannot be compared directly with each other. Now the full traces grow from left to right. The blue index rises from early zero catches, though it jumps between years. The white index is lower after its early high values. Each dot is one year inside a longer pattern. One blue point towers above nearby years. Should that single point settle the story, or should scientists use the full series? Make your prediction.
Use the full series. One year can be unusually high or low. A zero also means none were caught in that survey, not that none lived anywhere in the river. The other years keep one point in context. Compare each fish with itself across time. The blue index became higher, while the white index stayed below its early high values. That opposite pattern shows that the surveyed river community changed. An index tracks change; it does not count every fish. But a survey shows a pattern, not its cause.
Shared prey makes competition one possible explanation. Pollution, habitat loss or other changes could also have affected white catfish. The graph alone cannot choose among those possibilities. A careful claim has three parts. State the pattern, point to values from the same years, then explain a possible link. Keep may in the reasoning because the cause remains uncertain. That small word keeps the evidence honest. The survey adds evidence to our river picture. When people change an ecosystem, populations may rise or fall.
Evidence shows the pattern; further tests are needed to identify causes. Good science protects that line between observation and explanation.
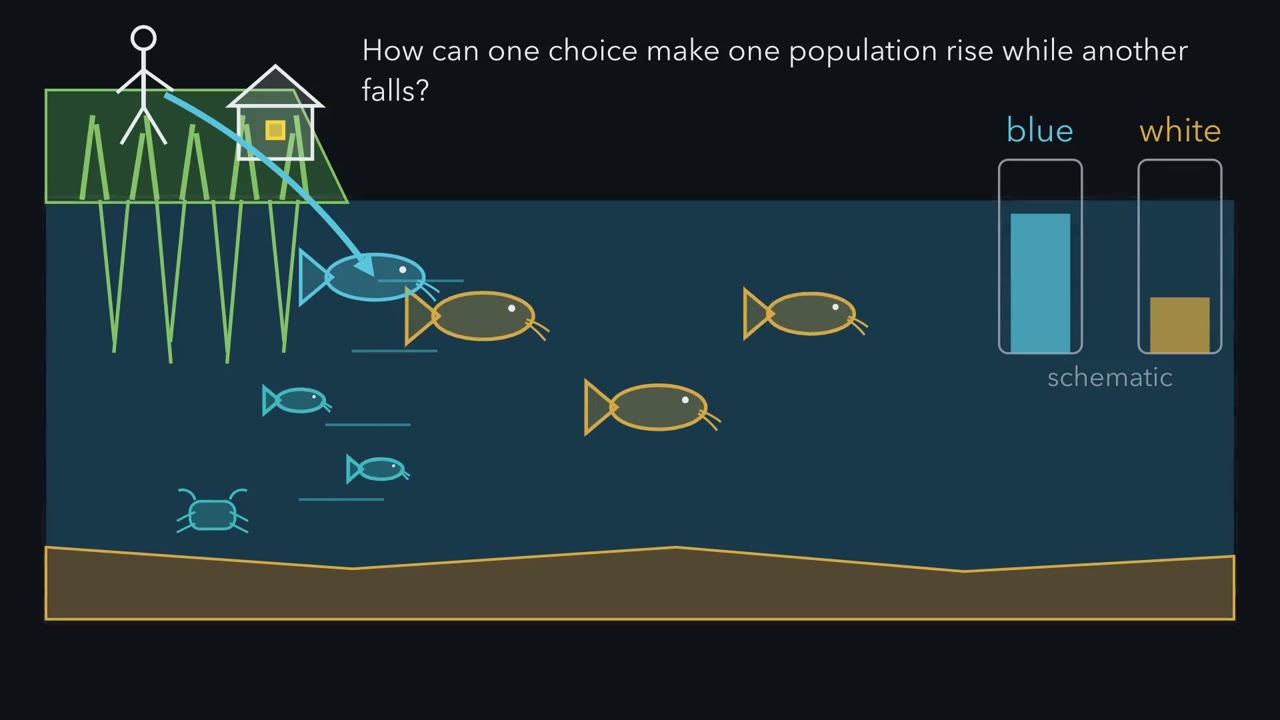
People put blue catfish into Virginia rivers for fishing, so what could that mean for the crabs and native fish already living there?
Continue in the lesson: People Change Habitats →
3:22 · Free, with captions and a transcript. The lesson has the full text, the questions and the sources.
More films from this lesson
How this film was made. Narration: an AI narrator voice (Kokoro, af_heart) reading narration written from this lesson's text. Animation: AI-generated in code (Manim) by Claude, a schematic with no drawn molecular structures. Captions come from the narration script. See something wrong? Report it.