Films · Genetics and Molecular Biology
Why the Map Outgrows the Count
Read the transcript of “Why the Map Outgrows the Count”
Film transcript: Why the Map Outgrows the Count
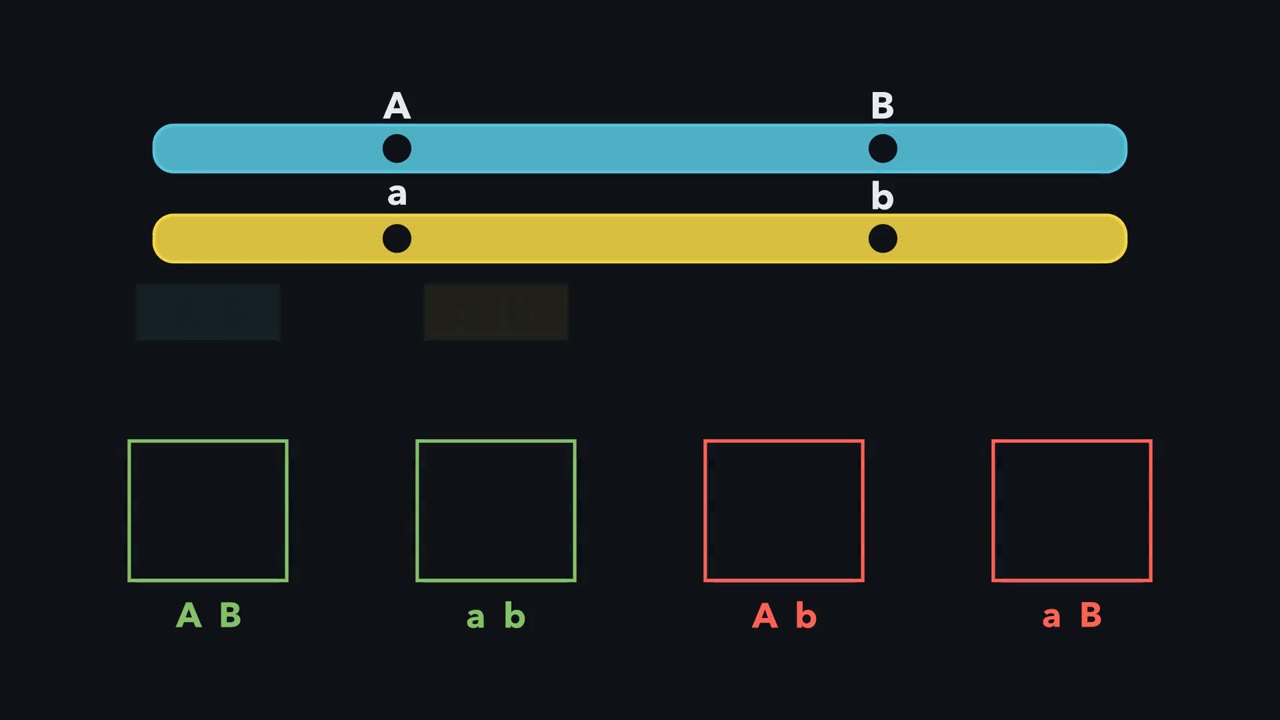
The first film turned recombinant offspring into a short chromosome ruler. Why does that ruler fail when the interval grows? Reuse the blue and gold homologues. Move their outside markers apart, and let more crossover sparks fall between them. The map keeps growing, but the observed count cannot follow forever.
A two-point cross does not count crossover events. It reads only the final combination of the outside markers. One exchange between them flips a parental combination into a recombinant one. Another exchange can flip that combination again. The gamete remembers its ending, not the number of turns. The chromatid now looks recombinant at the outside markers. What will those markers show after another crossover lands inside the same interval? Follow only their colours, not the crossed segments in the middle.
The second flip can restore the parental outside combination. The middle still records exchanged material, but a two-point score misses it. Even numbers of effective flips look parental. Odd numbers look recombinant. Long intervals contain more hidden histories that finish with the same visible answer. Across many meioses, repeated flips make parental and recombinant endings equally likely. Recombination frequency therefore approaches its ceiling. So distant linked loci can look unlinked, like loci on different chromosomes. A two-point result at the ceiling cannot distinguish those cases. Now plot what the count can see against map distance. Use Haldane's no-interference equation, not a sketch.
The computed curve starts close to a straight line, then bends toward the ceiling. Distance continues across the axis while the observable frequency loses sensitivity. A third marker breaks a long span into shorter intervals. Count each short interval where fewer exchanges stay hidden. Place those distances end to end on one chromosome. Their map distances add. Their raw recombination frequencies do not, because the whole-span count can erase double crossovers. The computed curve is a model, not a universal correction. Haldane assumes independent crossover placement. Interference changes how often nearby crossovers occur, so another function may fit better. The durable practice is to map short intervals, add their distances, and state the model behind any correction.
The count reports a final marker state. The map represents the expected number of crossovers per chromatid across the interval. Those quantities track closely only while hidden exchanges are rare. As the interval grows, the map can keep lengthening after the count has nearly stopped changing.
Independent assortment predicts four equal test-cross classes. Why do two classes dominate?
Continue in the lesson: Linkage and Recombination Mapping →
3:29 · Free, with captions and a transcript. The lesson has the full text, the questions and the sources.
More films from this lesson
How this film was made. Narration: an AI narrator voice (Kokoro, af_heart) reading narration written from this lesson's text. Animation: AI-generated in code (Manim) by Claude, a schematic with no drawn molecular structures. Captions come from the narration script. See something wrong? Report it.