Test the Pyramid with Real Data
Read the transcript of “Test the Pyramid with Real Data”
Film transcript: Test the Pyramid with Real Data
The first film followed energy through the Bay. Do real measurements shrink in the same neat pattern? Test the model with one measured ecosystem. The measurements come from Silver Springs, Florida. Researchers estimated yearly energy entering each feeding level. The values were rough, but they let us test the pyramid's shape. Each value combines many lives across a shared area. Start with energy captured by plants and algae. Their green bar fills most of the frame. This is the producer level and the base for the consumer paths. Everything above depends on this incoming supply. Now add the consumers in order. Each measured bar is narrower than the one below.
A narrower bar means less energy entered that level. Yet the bars do not shrink by one identical fraction. Calculate each transfer by dividing a level by the one below it. Each result describes only one jump between neighboring levels. A fixed law would make every result match. The uneven bars already hint otherwise. Will the three calculated percentages match exactly, or will they differ? Choose before the results appear. Use each neighboring pair in the stack.
They differ. The three measured steps land in different places around the model marker. Real transfer varies even within one ecosystem. No single measured step defines the whole web. The missing energy did not vanish. Organisms released much as heat during life processes. Uneaten material and wastes carried stored energy into a decomposer side branch. Decomposers receive material from the whole web, so they sit beside the stack. The producer row needs special care. It counts all captured energy. Plants used much themselves, so only part became new plant material that consumers could eat. That smaller block is the producer material available for growth and feeding.
These bars measure energy flow, not animal counts. One large organism and many small ones can use similar totals. They came from one spring and rough estimates. The pattern can guide a claim without predicting an exact population. Return to the Bay. Different feeding steps can pass different fractions. The exact width may change, but the upward supply narrows. Repeating those losses still leaves far less energy near an osprey than near the producers. The measurements refine the classroom model without changing its main pattern. At each feeding step, less energy is available to the next level. Use the rule for direction, then use data for size.
Every step passes on less energy, but how much less varies.
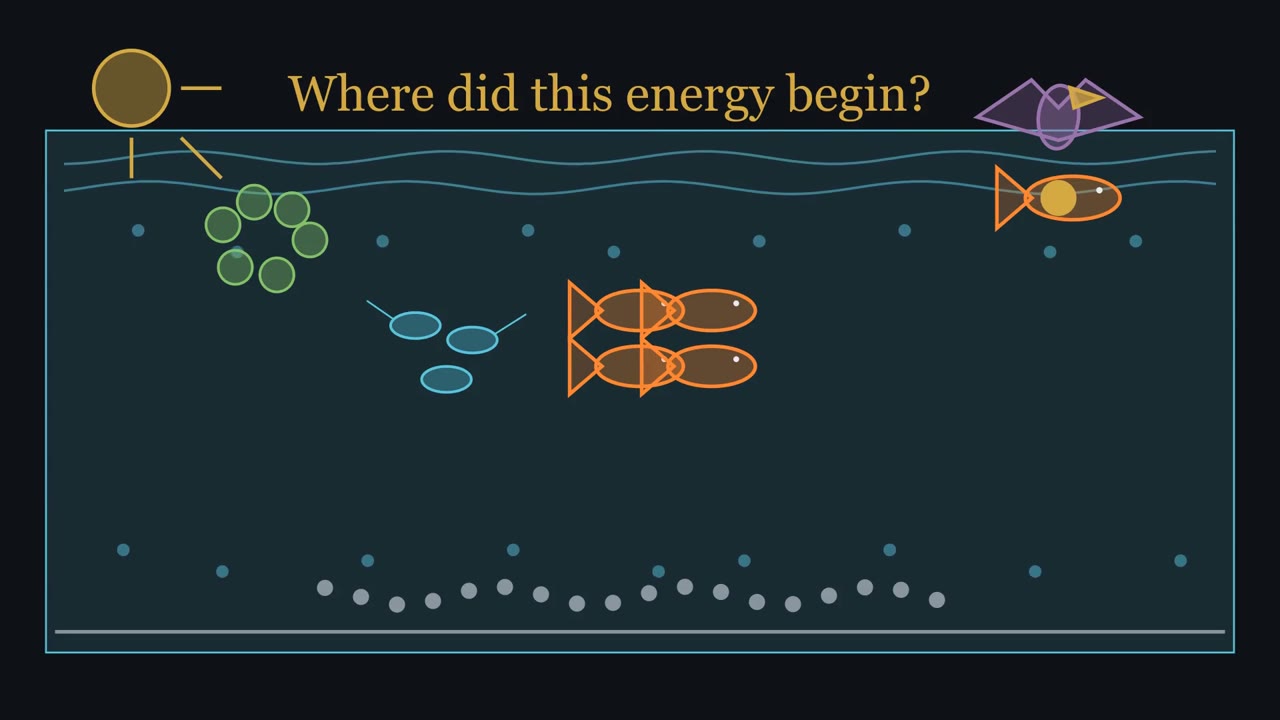
If ospreys eat menhaden and menhaden eat plankton, how much of the sun’s energy ever reaches an osprey?
Continue in the lesson: Food Webs and Energy →
3:32 · Free, with captions and a transcript. The lesson has the full text, the questions and the sources.
More films from this lesson
How this film was made. Narration: an AI narrator voice (Kokoro, af_heart) reading narration written from this lesson's text. Animation: AI-generated in code (Manim) by Claude, a schematic with no drawn molecular structures. Captions come from the narration script. See something wrong? Report it.