When Nature's Calendar Shifts
Read the transcript of “When Nature's Calendar Shifts”
Film transcript: When Nature's Calendar Shifts
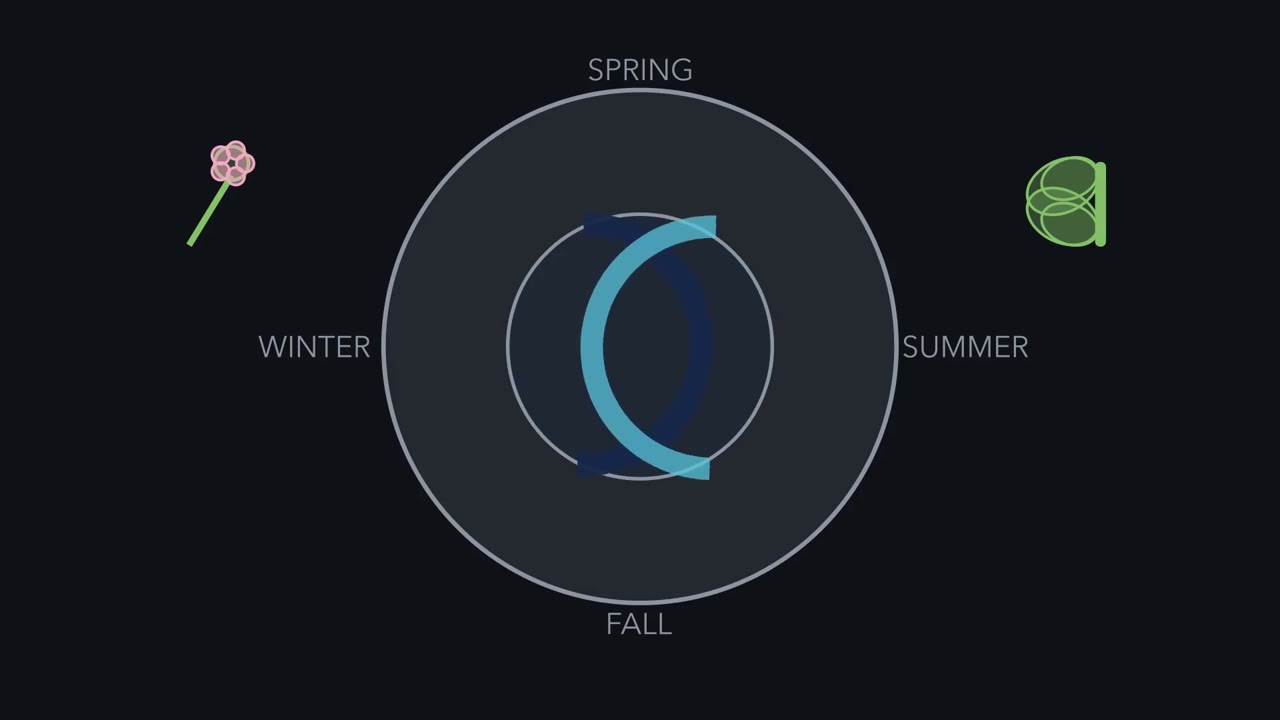
The first film showed how rhythms and cues time responses. What happens when cue patterns change for years? Return to the same dial. The nearest dial still holds a cherry bud. This time, stack many years behind it. Long-term change can come from natural events or from people.
Wildfires and floods can happen naturally. People can cause pollution and habitat destruction. Change can alter population size, location, relationships, or timing. Here we will follow timing, using one group of cherry trees. Suppose winter and early spring become warmer across many years. A tree that responds to warmth may bloom earlier. On each new dial, the red warmth band reaches the bud sooner. The green bloom marker slides earlier on this schematic dial. But warmth is not the only cue. Many buds need enough cold first. If winter becomes too warm, some may open late or unevenly. Warming does not force every response earlier. Different timing systems can give different results.
Now predict. One spring has an unusually early bloom. Does that single year prove the long-term pattern moved? The rest of the record stays hidden. Hold your answer while one green point appears on an empty timeline. No. One year can differ for many reasons. A long-term claim needs repeated observations made with the same rule. Observers use a fixed rule for peak bloom. At the Tidal Basin, observers recorded peak bloom across nearly a century. The record uses day of year. A smaller day number means an earlier date. That direction can feel backward at first. Imagine the year as a ruler from winter toward summer. Moving left means blooming earlier.
Scientists can group years and compare mean bloom days. The plotted means wiggle. The line never becomes a smooth staircase. Several groups are later than the group before. After the group with the latest mean, the means move earlier, though not in a steady line. Compare two groups on screen. Subtract the smaller mean from the larger mean. The smaller mean marks the earlier bloom. The difference shown is evidence of shifted timing. Be careful with the claim. These trees in one city do not represent every species. The dates show a pattern, but they alone cannot prove what caused it. Testing cause needs temperature evidence too. The dial, record, and limit fit together.
Organisms use timing systems. Long-term conditions can move the cues they meet. Responses may shift, while the details still depend on the organism. A careful claim keeps both pattern and limit.
How does a cherry tree with no calendar know when to bloom, and why might that day change?
Continue in the lesson: Daily and Seasonal Rhythms →
3:36 · Free, with captions and a transcript. The lesson has the full text, the questions and the sources.
More films from this lesson
How this film was made. Narration: an AI narrator voice (Kokoro, af_heart) reading narration written from this lesson's text. Animation: AI-generated in code (Manim) by Claude, a schematic with no drawn molecular structures. Captions come from the narration script. See something wrong? Report it.