The Mix Moves the Average
Read the transcript of “The Mix Moves the Average”
Film transcript: The Mix Moves the Average
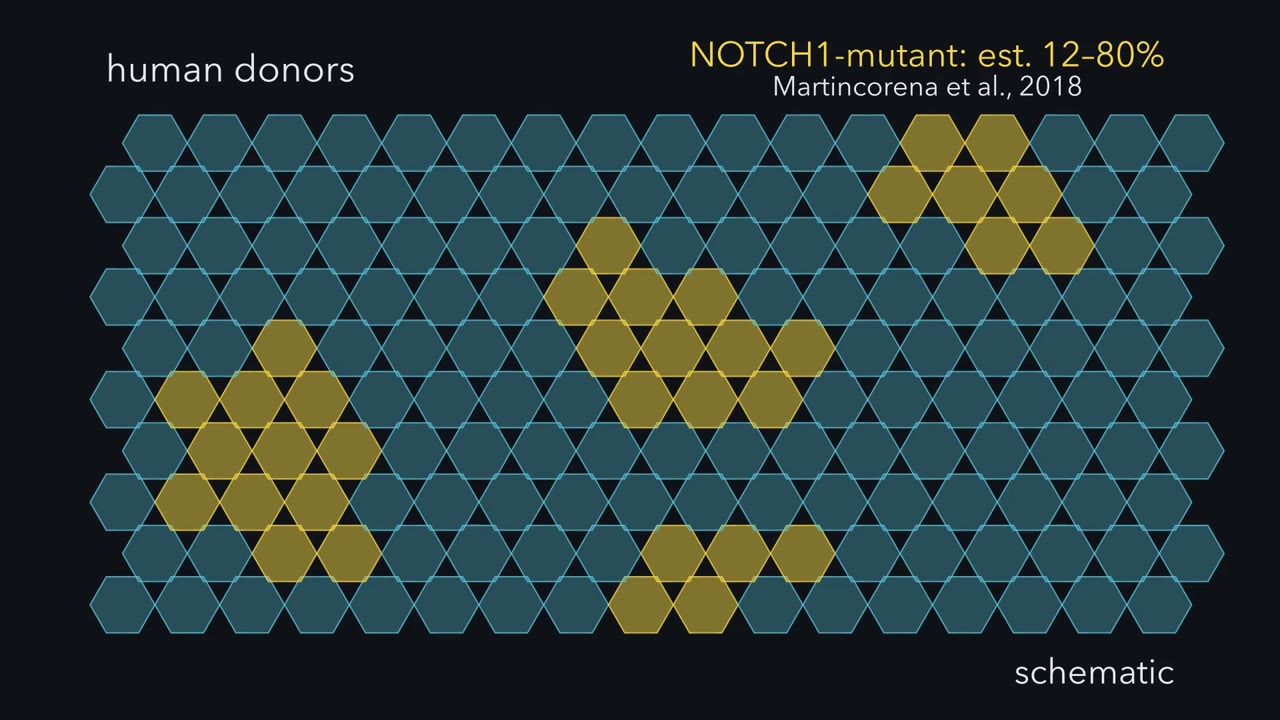
A bulk RNA reading rises. Did any cell turn the gene up? Chapter one ended on a lining whose mix of cells had changed. Gold clones spread, though on average their cells divided no faster. Now grind that lining up and measure one RNA.
Suppose, with made-up numbers, each gold cell holds 20 copies of one RNA. Each blue cell holds 10. Suppose our bulk assay reports copies per average cell. Early on, gold cells are 2 in 10. Two tenths of 20, plus eight tenths of 10, gives 12 copies per average cell. Later, the clones have spread, and gold cells are 6 in 10. No single cell changes how much RNA it holds. Does the bulk reading go up, go down, or stay the same?
It goes up. Six tenths of 20, plus four tenths of 10, gives 16. The reading rose by a third, yet no cell turned its gene up. Only the mix changed. That is the idea of this lesson. A tissue can change because which cells are there changes, not only because its cells behave differently. On its own, one average cannot tell those apart. To estimate the mix, measure sampled cells one at a time. Single-cell RNA sequencing usually starts by separating tissue into single cells, often with enzymes.
Each captured RNA is copied into DNA carrying a short barcode for its cell. Sequencing produces a count for each gene in each sampled cell. The result is a table, with one row per gene and one column per sampled cell. Software groups cells with similar expression profiles into clusters. Clusters are annotated by comparing their genes with known profiles. Now the shift can be estimated. The gold-profile group contains more sampled cells, while its within-group RNA level stays fixed. But what does a cluster represent? It might mark a cell type, a relatively stable identity such as a keratinocyte or T cell. It might instead mark a state within one type, such as dividing or differentiating. This distinction depends on the question.
Or it might reflect the method. Breaking up tissue can stress cells before capture. Cells from samples processed separately can split by batch. A clustering resolution setting can split or merge groups. A cluster is an observation; what it represents is a hypothesis.
A snapshot cannot reveal ancestry or future fate. Lineage tracing tests those. Perturbation tests cause, and protein can check an annotation. Back in the lining, gold cells became common, so the average moved. No cell made more RNA. Change the mix; the average moves without within-cell change.
Much of the lining of an older person's healthy oesophagus can carry mutations found in cancer. Why is it still healthy?
Continue in the lesson: Cell Identity, Cell State and Disease →
3:34 · Free, with captions and a transcript. The lesson has the full text, the questions and the sources.
More films from this lesson
How this film was made. Narration: an AI narrator voice (Kokoro, af_heart) reading narration written from this lesson's text. Animation: AI-generated in code (Manim) by Claude, a schematic with no drawn molecular structures. Captions come from the narration script. See something wrong? Report it.