Two Animals on One Plot
Read the transcript of “Two Animals on One Plot”
Film transcript: Two Animals on One Plot
Move a mussel and a shore crab from seawater into water diluted to half strength. Whose blood follows the water? The first film built a dial: push-back strength against leak strength. Now we read that dial off real animals. Draw a plot. Across the bottom goes the water's osmolality, the concentration of dissolved particles. Up the side goes the blood's osmolality. Orange marks the outside, teal the inside, as before. Draw the diagonal first.
Along it, blood equals water. That is a perfect conformer. Then draw a flat line. Along it, the blood stays put as the water changes. That is a perfect regulator, over the range it survives. The slope of an animal's line is the share of the outside change that gets inside. In the simple model, steep means leak is much stronger.
Flat means push-back is much stronger. A line halfway between means the two are about equally strong. Now the blue mussel, Mytilus edulis. Dilute its water, and over the salinities it tolerates, its blood comes close to the water around it. Its points fall along the diagonal. For blood osmolality, the mussel conforms. That label covers this one variable. Now the shore crab, Carcinus maenas. In full-strength seawater, its blood sits close to the water, near the diagonal. So far, the crab looks just like the mussel. Now dilute the water to half strength. Will the crab's blood sit on the diagonal, on the flat line, or in between?
In between. The crab holds its blood well above the water. Its line bends flatter in dilute water. So the crab conforms at one end of its range and regulates at the other. So regulator and conformer describe one variable over one range. They never describe a whole animal. Name one variable and a stated range before you choose a label. Now a second plot, for temperature. Outside temperature goes across. Body temperature goes up. Over the air temperatures a person can bear, an adult human regulates core temperature. That gives a nearly flat line. A typical fish in a lake gives a line near the diagonal. Its body temperature largely follows the water.
Two plots, one dial. Each line's slope is the share of an outside change that gets inside. It holds for that variable, over that range. In the simple model, that slope reads the dial.
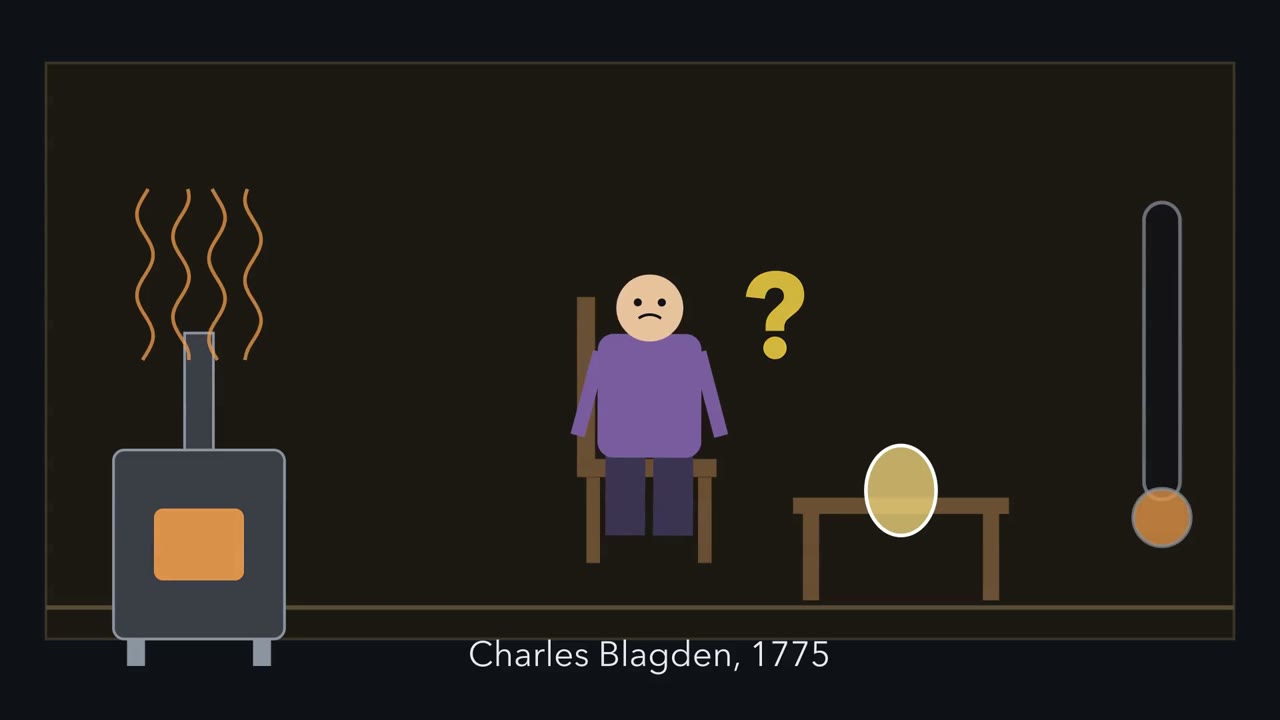
In a room heated to about 93 degrees C, close to the boiling point of water, the thermometer under a man’s tongue barely moved. What was holding it there?
Continue in the lesson: Tissues, Organs and Homeostasis →
3:18 · Free, with captions and a transcript. The lesson has the full text, the questions and the sources.
More films from this lesson
How this film was made. Narration: an AI narrator voice (Kokoro, af_heart) reading narration written from this lesson's text. Animation: AI-generated in code (Manim) by Claude, a schematic with no drawn molecular structures. Captions come from the narration script. See something wrong? Report it.