A Snapshot of the Cycle
Read the transcript of “A Snapshot of the Cycle”
Film transcript: A Snapshot of the Cycle
Which phase is each cell in? Freeze this dish of thousands: every cell looks unlabelled, but each carries clues. In chapter 1, one cell's kinase rose and fell once. Its genome was copied once. So DNA doubles once per cycle, then halves at division.
Start with DNA content. One C is one haploid genome's DNA. A diploid cell holds 2C in G1, and 4C in G2 and mitosis. The cell has not become tetraploid. It still has two homologous sets of chromosomes. By G2, each chromosome has two sister chromatids, doubling DNA without changing ploidy. C measures DNA amount, not chromosome-set number.
Stain fixed cells with propidium iodide, a dye that fluoresces when bound to nucleic acid. Add RNase, because the dye also binds RNA. A flow cytometer reads each cell's fluorescence. After RNA is removed, fluorescence is a proxy for DNA amount. Under the same staining conditions, a 4C cell gives about twice a 2C cell's signal. The comparison needs single cells measured consistently.
The dots pile up into a histogram. There is a peak at 2C and another at 4C. Cells in S spread between them, partway through copying. Read the axes before the labels. Horizontal position is fluorescence per cell, used here for DNA amount. Bar height is the number of cells. This plot is a population snapshot, not one cell moving through time. Here is one cell from the 4C peak. It has copied all its DNA. Is it still in G2, or already in mitosis?
The histogram cannot say. Mitotic cells share the 4C peak with G2. Quiescent G0 cells share the 2C peak with G1. DNA content narrows the phase; other markers can separate some look-alikes. Two more stains help. EdU is a thymidine look-alike. During a short pulse, cells copying DNA build it in, and click chemistry adds a glowing tag. It marks cells in S. EdU also catches cells at the borders. Early S cells can sit near the 2C peak, and late S cells near 4C. DNA content can blur both into neighbouring phases; EdU reveals ongoing synthesis. An antibody detects histone H3 phosphorylated on serine 10. This mark spreads across chromosomes as they condense.
It helps find mitotic cells, but it is not an exact boundary. The signal begins near centromeres in late G2, before mitosis. It spreads by prophase, remains strong through metaphase, then fades during anaphase. So a positive cell is usually mitotic, but timing keeps the call approximate.
G0 is harder: no single stain marks it cleanly. Together, these measures classify most cycling cells. But G0 versus G1 and the G2-mitosis boundary remain imperfect. So which phase is each cell in? DNA amount narrows the choices; EdU and phospho-H3 sharpen the answer. G0 remains unresolved.
How long each phase lasts is the text's next question.
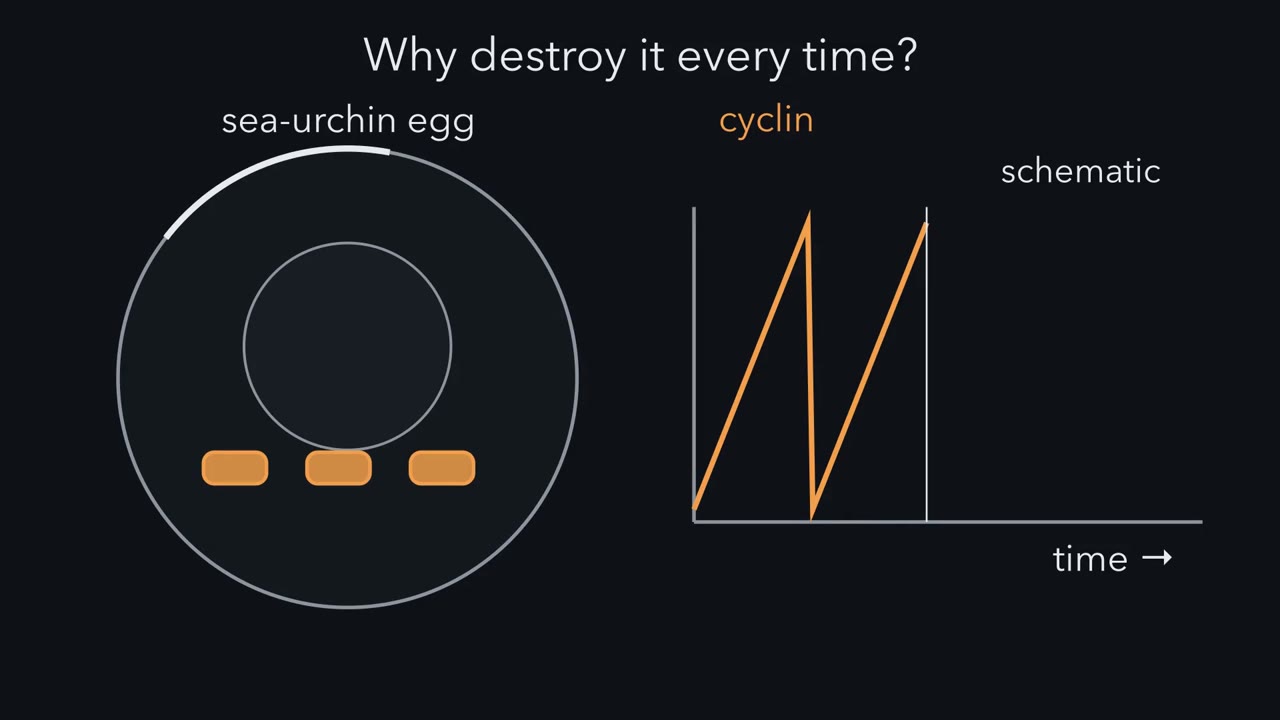
From yeast to humans, one kinase family drives every cell cycle, and it works only while a partner protein is present. Why would a cell destroy that partner every time it divides?
Continue in the lesson: Cyclin-CDK Control of the Cell Cycle →
4:18 · Free, with captions and a transcript. The lesson has the full text, the questions and the sources.
More films from this lesson
How this film was made. Narration: an AI narrator voice (Kokoro, af_heart) reading narration written from this lesson's text. Animation: AI-generated in code (Manim) by Claude, a schematic with no drawn molecular structures. Captions come from the narration script. See something wrong? Report it.