Ten Years at Cedar Creek
Read the transcript of “Ten Years at Cedar Creek”
Film transcript: Ten Years at Cedar Creek
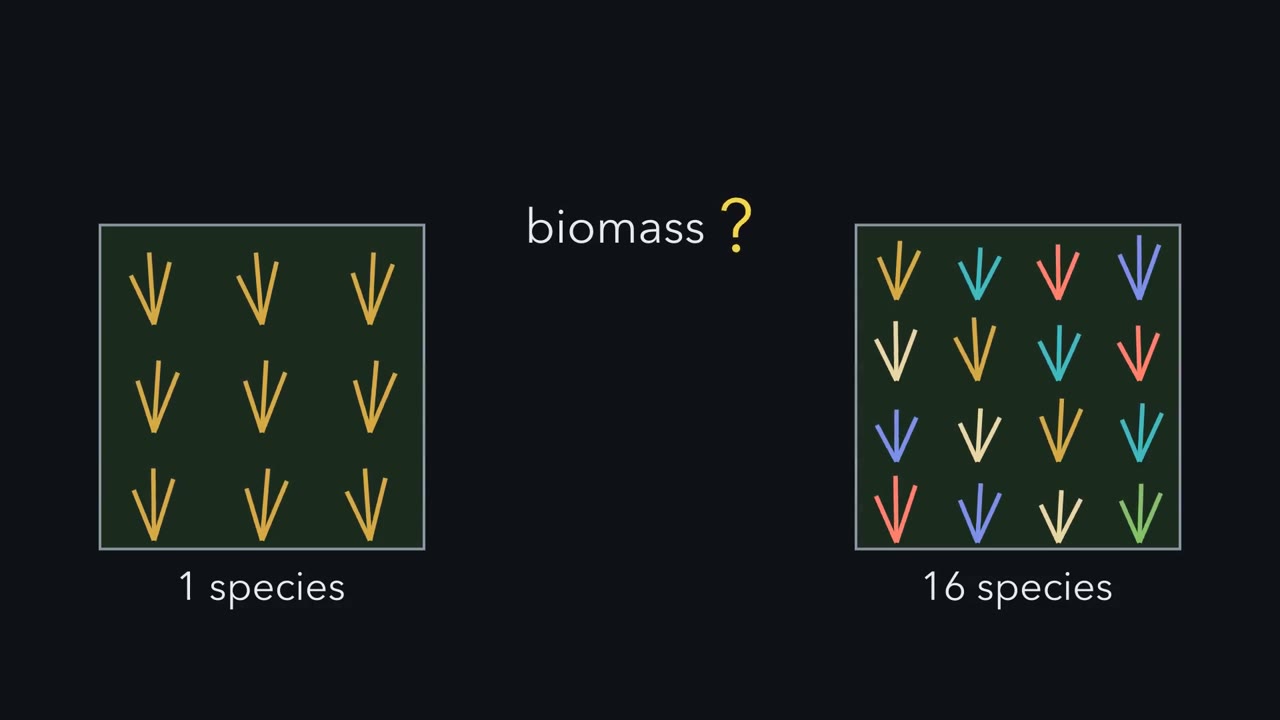
The first film showed a field as a sum of its species. Now follow one real field for a decade. How much of its extra yield is complementarity, and how much is selection? Does the answer change as the plots age? The field is Cedar Creek, in Minnesota. In spring nineteen ninety-four, David Tilman and colleagues sowed a hundred and sixty-eight plots there. Each plot was nine metres on a side. Each plot got one, two, four, eight or sixteen species. They were drawn at random from a pool of eighteen grassland and savanna species. Every plot got the same seed mass. Because the draw was random, nobody chose strong species for the rich plots. Better soil could line up with richness only by chance.
Every year the plants were clipped, dried and weighed. Year after year, plots with more species generally grew more aboveground biomass. Joseph Fargione and colleagues then split the extra yield in each year, using every species' yield in mixture and alone. The green bar is complementarity. The violet bar is selection. In the early years, selection was positive. Rich plots outyielded poor ones partly because they more often held a productive species. Then the balance shifted toward complementarity. Selection shrank, crossed zero and ended strongly negative. Now the biggest gains went to species that yield little alone. The extra biomass came to be associated with more nitrogen held in the plants.
So the same plots gave a different answer depending on which years you looked at. Each year's split is a snapshot, and the snapshots changed. Now zoom into the sixteen-species plots and follow their species. On average, each species swings proportionally more from year to year than species in poorer plots. So the parts became less steady, on average. Will the plot's total be more steady, or less steady, than a monoculture's?
More steady. Tilman, Peter Reich and Johannes Knops reported this in two thousand six. The total varied proportionally less, even though its species, on average, varied more. Did opposite swings grow stronger in richer plots? Their analysis found no evidence of that. Averaging, together with a higher mean, explained the steadier total. A higher mean helps only if the swings grow less than in proportion. Assigned at random and watched for a decade, richer plots grew more and grew steadier. Their species, on average, grew less steady.
Grassland plots sown with sixteen species generally out-grew plots with one, yet the species inside them were, on average, less steady from year to year. How can the total be steadier than its parts?
Continue in the lesson: Biodiversity and Ecosystem Function →
3:14 · Free, with captions and a transcript. The lesson has the full text, the questions and the sources.
More films from this lesson
How this film was made. Narration: an AI narrator voice (Kokoro, af_heart) reading narration written from this lesson's text. Animation: AI-generated in code (Manim) by Claude, a schematic with no drawn molecular structures. Captions come from the narration script. See something wrong? Report it.