Films · Genetics and Molecular Biology
How Far Is Too Far?
Read the transcript of “How Far Is Too Far?”
Film transcript: How Far Is Too Far?
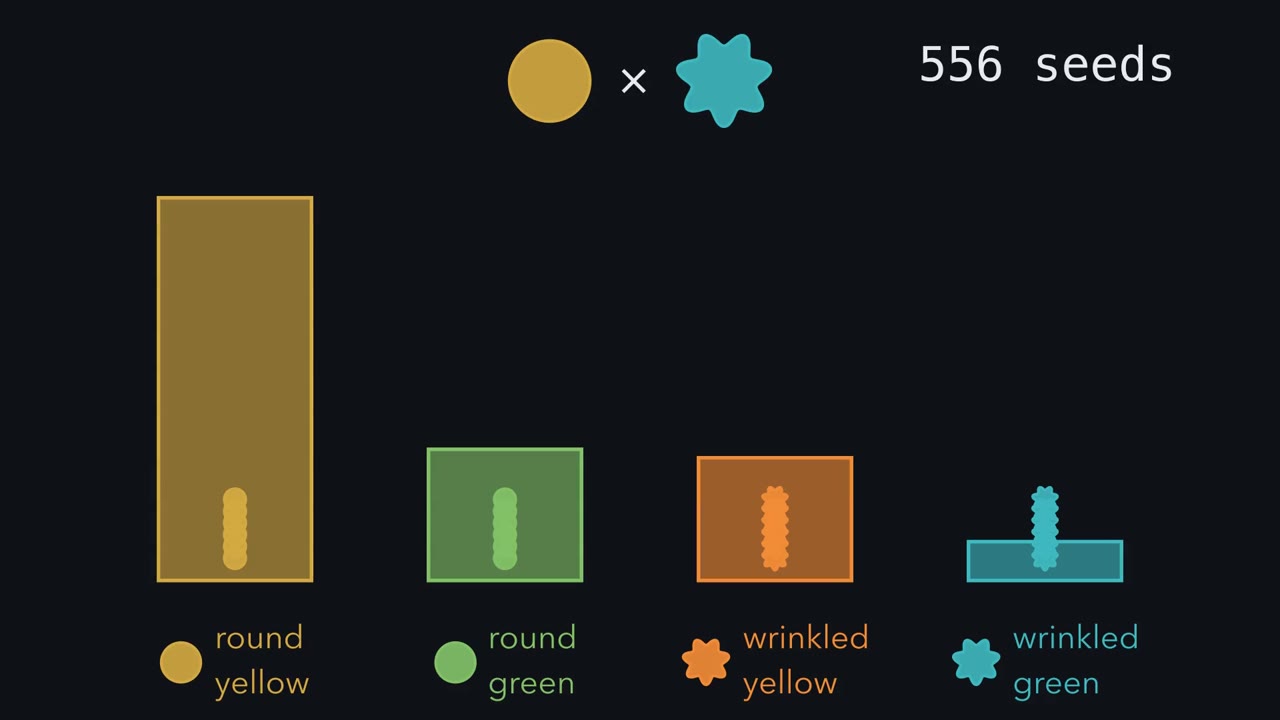
How far can counts stray from a ratio before chance becomes a poor explanation? Chapter 1 showed that real counts usually scatter. Now we measure the scatter. Back to Mendel's seeds. Every class missed its predicted count by a few seeds. Some came in high, and some came in low. Is that close enough to keep the ratio? a miss of a few seeds a lot? That depends on the class. In this cross, chance moves a bigger pile further than a smaller one. The round yellow pile, the biggest, strays furthest. The small wrinkled green pile strays least. So judge each miss against the scatter in its own class. Karl Pearson built a score for this. For each class, square the miss, so high and low both count.
Divide by the expected count. That roughly puts each miss on its own class's scale. Then add the classes. The score is called chi-square. Zero means a perfect match, and bigger means further off. Mendel's seeds score well under one. But is that small? We need to know what chance alone produces. So assume the ratio is true. Let a computer grow Mendel's cross thousands of times, and score every run. Each run drops one dot on this line, at its chi-square score. Where will the pile of dots balance?
It balances at three, not four. Each class adds a little less than one, on average. Four classes share one total. Once three counts are known, the fourth is fixed. So only three misses are free. Three is the degrees of freedom. Now mark the far edge. Only one run in twenty scores beyond this line. Counts out here would be rare if the ratio held. That is a reason to doubt the ratio.
Now drop Mendel's score onto the pile. It sits far to the left, deep inside the pile. Most chance runs land further out than his did. That share of runs is called the p-value. Read it carefully. The p-value is worked out as if the ratio, and every other assumption, were true. That means independent seeds, correct scoring and equal survival. It is not the chance that the ratio is true. And a large p-value does not prove the ratio. It gives no reason to reject the ratio. Other models might fit these counts just as well. So here is the idea. A ratio predicts a spread of counts. If the ratio holds, chi-square averages its degrees of freedom. Far above that, doubt the ratio, but never call it proof.
A 9:3:3:1 ratio predicts 312.75 round yellow seeds among Mendel's 556, and he counted 315. How far off can a count be before chance stops being a good explanation?
Continue in the lesson: Probability, Crosses and the Chi-Square Test →
3:23 · Free, with captions and a transcript. The lesson has the full text, the questions and the sources.
More films from this lesson
How this film was made. Narration: an AI narrator voice (Kokoro, af_heart) reading narration written from this lesson's text. Animation: AI-generated in code (Manim) by Claude, a schematic with no drawn molecular structures. Captions come from the narration script. See something wrong? Report it.